Prices eased across Canberra in the September quarter, and Belconnen was no exception. But Belconnen auctions are still clearing well above the territory average, and Belconnen houses are selling faster than houses in most other districts. If you are weighing up a sale, here is what changed.
All figures below are from the Allhomes Market Insights fact pack, September 2026 edition. Median prices and rents are for the September 2026 quarter. Auction, listing, days on market, discounting and vacancy figures are for September 2026. Everything is quoted as published.
Belconnen at a glance
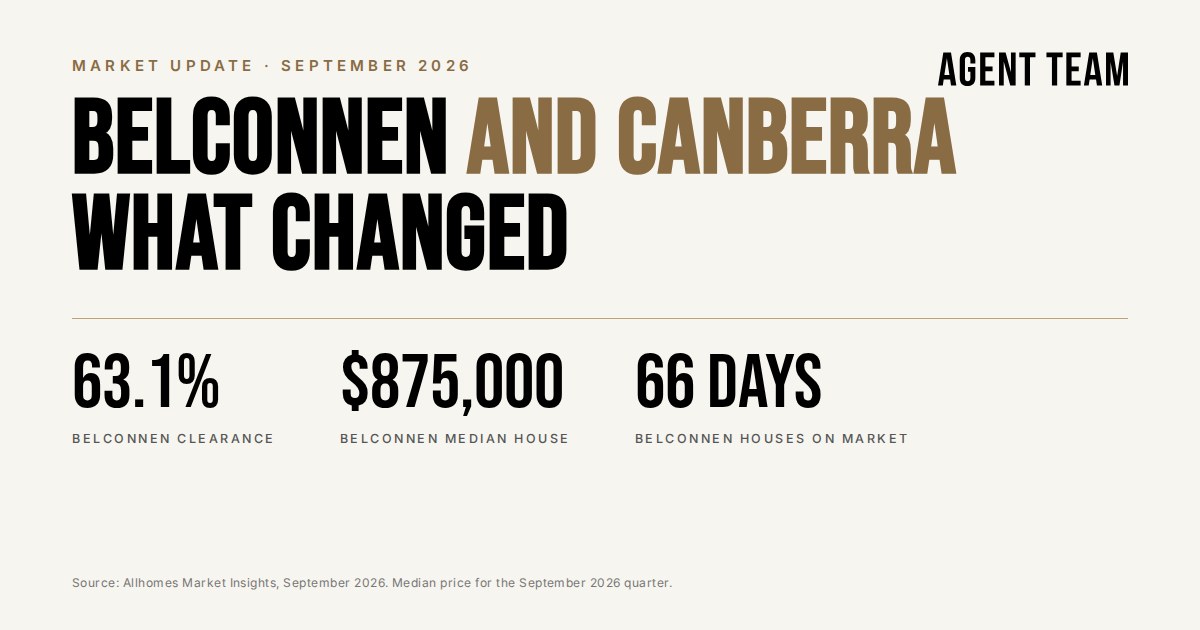
- Auction clearance: 63.1%, down 12.4 percentage points on the year (Canberra 50.0%)
- Median house price: $875,000, down 2.8% on the quarter and up 2.2% on the year
- Median unit price: $445,000, down 6.3% on the quarter and down 7.5% on the year
- Days on market: houses 66 (64 a year ago), units 96 (102 a year ago)
- Discounting: houses 5.5% (5.3% a year ago), units 6.3% (4.4% a year ago)
- New listings: up 21.1% on the month and down 7.8% on the year
- Total listings: flat on the month and up 2.6% on the year
- Distressed listings: 0.7% of listings (1.7% a year ago)
1. Belconnen houses held up better than the territory
The Belconnen median house price is $875,000 for the September quarter. That is down 2.8% on the quarter but still up 2.2% on the year. Across Canberra, the median house price is $1,025,084, down 2.6% on the quarter and down 0.9% on the year. Allhomes describes it as the steepest quarterly fall for Canberra houses in 3.5 years.
So Belconnen houses eased this quarter in line with the rest of Canberra. The difference is that they are still ahead of where they were a year ago, while the territory figure has now gone backwards.
2. Units are where the pressure is
The Belconnen median unit price is $445,000, down 6.3% on the quarter and down 7.5% on the year. Across Canberra, the median unit price is $485,276, down 4.2% on the quarter and down 6.0% on the year. Allhomes reports that as the largest quarterly fall for Canberra units in 6.5 years.
Belconnen unit discounting rose to 6.3%, up from 4.4% a year ago. Belconnen units are selling a little faster than a year ago, though, at 96 days compared with 102. Buyers are still buying units. They are negotiating harder to do it.
3. Belconnen auctions are still among the strongest in Canberra
Belconnen cleared 63.1% of auctions in September, down 12.4 percentage points on the year. The Canberra clearance rate was 50.0%, up 3.7 percentage points on the month and down 16.4 percentage points on the year, on 299 auctions. The share of Canberra auctions withdrawn rose to 19.1%, the highest since 2013.
September auction clearance by district:
- Tuggeranong 63.9%, down 4.5 percentage points on the year
- Belconnen 63.1%, down 12.4 percentage points
- Woden Valley 62.9%, down 10.5 percentage points
- South Canberra 54.5%, up 10.3 percentage points
- Weston Creek 37.5%, down 55.6 percentage points
- North Canberra 37.1%, down 24.1 percentage points
- Gungahlin 34.1%, down 26.9 percentage points
- Molonglo 16.7%, down 19.0 percentage points
Auctions still work well in Belconnen. They work best for the right property, with the right price guidance and with buyers lined up before launch.
4. More choice for buyers
Belconnen new listings rose 21.1% over the month, though they are down 7.8% on the year. Total Belconnen listings were flat on the month and are up 2.6% on the year.
Across Canberra, total listings reached a record high for September, up 6.9% on the year. Buyers have plenty to choose from, and they are taking their time. Canberra houses took 71 days to sell and units 106. Discounting was 6.1% for houses and 6.3% for units, the highest for units since 2008.
Belconnen houses are moving faster than that, at 66 days with 5.5% discounting. Tuggeranong (47 days) and Weston Creek (64 days) were the only districts where houses sold faster.
5. Rents
The Belconnen median asking rent is $675 a week for houses (up 3.8% on the year) and $550 a week for units (also up 3.8% on the year). The Belconnen vacancy rate is 1.3%, the same as August and up from 1.1% a year ago. Across Canberra, vacancy rose to 1.5% and rental listings are up 25.3% on the year.
One quietly good sign
Distressed listings across Canberra fell to a 10 month low. In Belconnen, distressed listings make up 0.7% of listings, down from 1.7% a year ago. Prices are easing, but sellers are not being forced out of the market. Buyers have more choice and more time, and they are using both.
What this means if you are selling in Belconnen
Conditions like these reward preparation more than hoping.
Buyers have choice, so presentation decides whether your home makes their shortlist. They have time, so the price you launch at decides whether they engage in the first two weeks, when the best buyers are looking. And with listings up on the year, how widely your home is marketed decides how many buyers even see it. You control all three of those. You do not control the clearance rate.
Check your own district and property type rather than the Canberra figure. A Belconnen house and a Belconnen unit are in very different markets this quarter, and a plan built on the Canberra average will not fit either of them properly.
A note on these figures
The Allhomes fact pack reports at district level, the ABS SA3 regions: Belconnen, Gungahlin, Molonglo, North Canberra, South Canberra, Tuggeranong, Weston Creek and Woden Valley. A district figure describes the broader market your suburb sits in. It does not describe your suburb itself, and certainly not your home. To see what is happening in your street, we look at individual recent sales alongside these numbers.
If you would like us to walk you through your own district and property type, with recent comparable sales, that conversation is worth having before you make any decisions.